Walt: Evaluating - I gather, and synthesize to evaluate information across a range of text
For this week in literacy we read about environmental gases. We had to read to different text and the two gases they talked about was Biogas made of fresh dung, and methane gas from rubbish dumps. Biogas is formed when fresh dung goes into a Biogas Plant and goes out one side into you kitchen where the stove is. This gas is used for cooking which is really useful. The Methane gas provides electricity and that is also very useful. I really enjoyed learning about these environmental gases and if there was a power outage I would have a solution in mind.
Friday, 2 June 2017

Thursday, 1 June 2017
Statistacs
Walt: Interpret information from different graphs
For this week we were introduced to a new type of graph which is the dot plot. In this presentation there were many things included for our learning such as, statistics, reading diagrams and probability. I had to gather information from the graph to answer the question with and I found really easy to find information from this graph. I am very excited and looking forward to learning more about different graphs and how they're laid out.
For this week we were introduced to a new type of graph which is the dot plot. In this presentation there were many things included for our learning such as, statistics, reading diagrams and probability. I had to gather information from the graph to answer the question with and I found really easy to find information from this graph. I am very excited and looking forward to learning more about different graphs and how they're laid out.
Probability
Walt: Calculate the probability of an event happening
Probability... what is it? Probability is the likeliness of something happening. At the end of this presentation we got to do our own experiment around probability using a coin. With a toss of a coin there are only two chances that the coin will land on heads. I think that I have achieved the WALT because I am very positive that my answers are correct and I understand what probability is now. What I have learnt from this lesson is how to predict what is going to happen in a probability experiment. For example, if you had 7 marbles in your hand, 5 transparent and 2 red what is the chance of you picking out a red marble? Please leave a comment showing you answer and your strategy.
Probability... what is it? Probability is the likeliness of something happening. At the end of this presentation we got to do our own experiment around probability using a coin. With a toss of a coin there are only two chances that the coin will land on heads. I think that I have achieved the WALT because I am very positive that my answers are correct and I understand what probability is now. What I have learnt from this lesson is how to predict what is going to happen in a probability experiment. For example, if you had 7 marbles in your hand, 5 transparent and 2 red what is the chance of you picking out a red marble? Please leave a comment showing you answer and your strategy.
Wednesday, 31 May 2017
Space Exploration
NASA stands for:
National Aeronautics and Space Administration
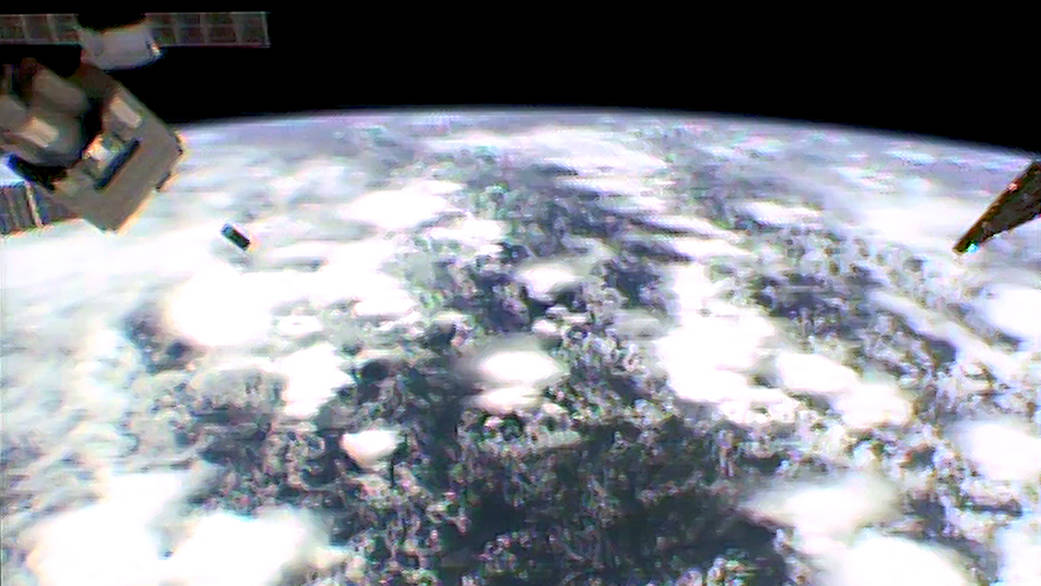
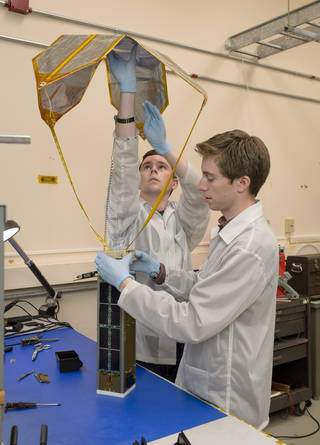 The exo-brake will be deployed from the International space station through a small spacecraft. An exo-brake is a tension-based, flexible braking device that deploys from the rear of the satellite. It has a cross parachute. Why they deploy it from the rear of the satellite? They deploy it from the rear of the satellite because the cross-like parachute drags in space and so it will give them time to scan around the space station and around the satellite itself.
A Brief History Of Space Exploration
In the 1930s to 1940s Nazi Germany saw the possibility of using long-distance rockets as weapon. In 1961 Alan Shepard became the first American to fly into space.
Thursday, 18 May 2017
Literacy / Numeracy
For this week we started learning about statistics. Although some of us knew about it already, most of us forgot. This presentation was really good in our session because we learnt a bit more than we already knew. We got create bar graphs and pie graphs using data from a question.
Exciting Numeracy
Walt: Interpret information from a graph
This week we have been learning more about statistics and creating different graphs. The graph that we had to make was a stem and leaf graph. Stem is the tens column and the leaf is the ones column.
Tuesday, 9 May 2017
Heat On The Move
This is our group diagram that we created about the Heat Transfer Process. We found these facts on the text that we read called Warming up and Cooling Down. My partner Mitchell and I created this diagram. Please feel welcome to leave a comment if you like.
Subscribe to:
Posts (Atom)